New York - February 28, 2017
Erich Ess on Imaging Vector Fields Using Line Integral Convolution
- Meetup: https://www.meetup.com/papers-we-love/events/237581430/
- Papers: Imaging Vector Fields Using Line Integral Convolution
- Slides: Erich Ess on Imaging Vector Fields Using Line Integral Convolution
- Audio: Erich Ess on Imaging Vector Fields Using Line Integral Convolution
Description
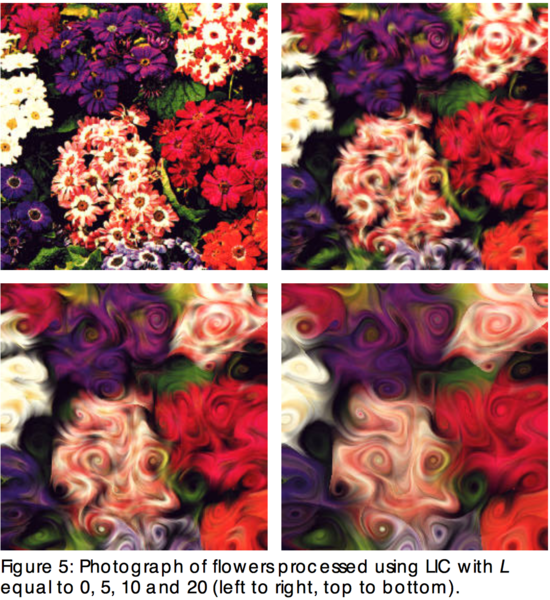
Line Integral Convolution is one of the most intuitive data visualization techniques around. It's dropping paint in a river to see how the current is flowing: to visualize a vector field simply take an image and have the vector field smear the colors. The result is a powerful alternative to using arrows or stream lines. And while the intuition is very straightforward, the actual mathematics that power the technique are very complex.
Bio
Erich Ess (@egerhardess) is a lead engineer on the Core Platform team at Jet.com. His current work focuses on semantics for programmatic represention of distributed processes and advanced monitoring and insight platform for high distributed high volume systems. Before that he was a CTO in Chicago and an engineer in San Diego. He studied Computer Science and Pure Mathematics in college and did research in scientific visualization before escaping academia.
Audio
Slides
 The New York Chapter would like to thank TwoSigma for helping to make this meetup possible.